

Knowledge base
AI Presence Dashboard
Introduction
The AI Presence Dashboard in Local helps businesses understand how they are seen, represented, and recommended by AI platforms. It brings together AI visibility, share of voice, business information accuracy, optimization opportunities, geographic performance, and competitive insights. Use the dashboard to identify visibility gaps, correct information that may affect AI responses, and prioritize actions that can strengthen your presence across AI-powered discovery experiences.
Step 1: Access the AI Presence Dashboard
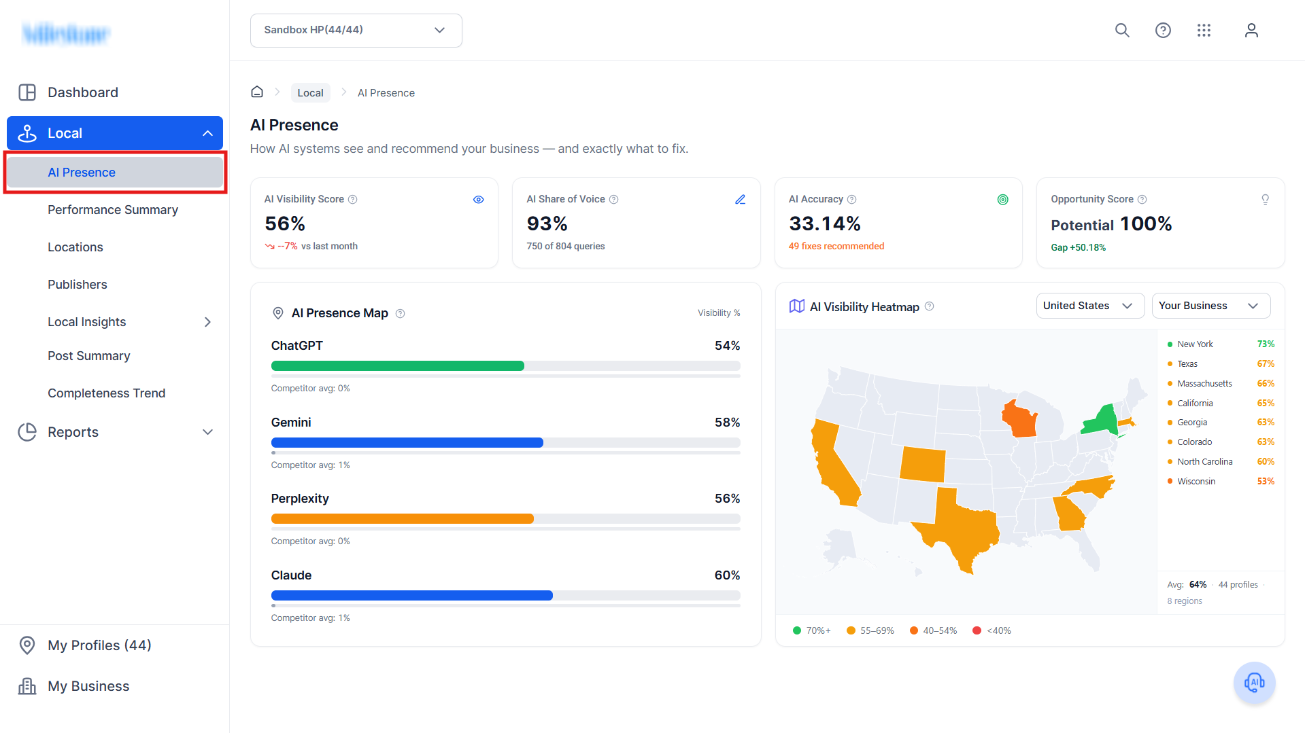
- Log in to the platform.
- Select the appropriate account or business from the account selector at the top of the screen.
- From the left navigation menu, select Local.
- Select AI Presence.
- The AI Presence Dashboard opens with four primary metrics:
- AI Visibility Score
- AI Share of Voice
- AI Accuracy
- Opportunity Score
- Below these metrics, you can review the AI Presence Map and AI Visibility Heatmap.
The dashboard gives you a high-level view of how discoverable your business is across AI platforms and where improvements may be needed.
Step 2: Review the AI Visibility Score
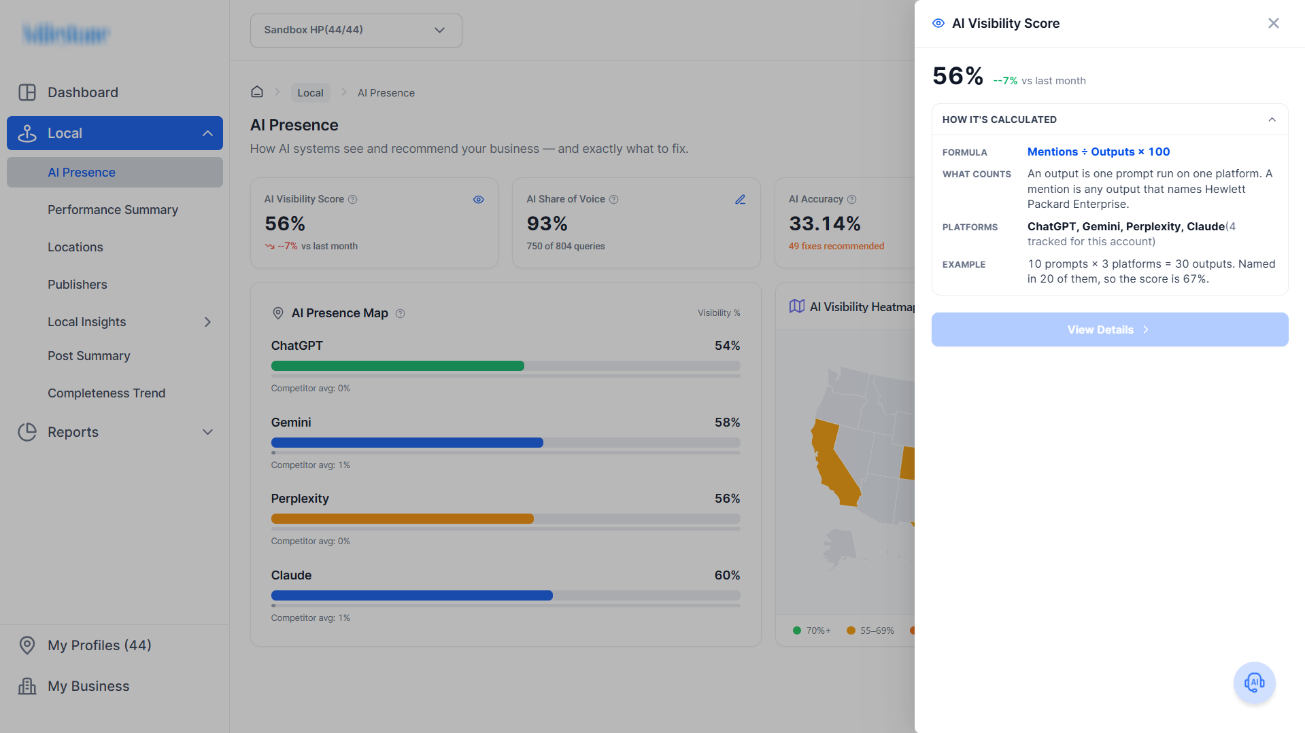
The AI Visibility Score indicates how visible your business is across the AI queries being monitored.
- Locate the AI Visibility Score card at the top of the dashboard.
- Review the percentage displayed.
- Review the change compared with the previous month to determine whether visibility is increasing or decreasing.
- Select the eye icon on the card to open additional information.
- Review the current score and month-over-month movement.
- Expand How It's Calculated for more information about how the metric is determined.
- Select View Details when you want to investigate visibility performance further.
For example, a score of 56% indicates the current level of AI visibility, while the monthly comparison helps you understand whether performance is improving over time.
Step 3: Review AI Share of Voice
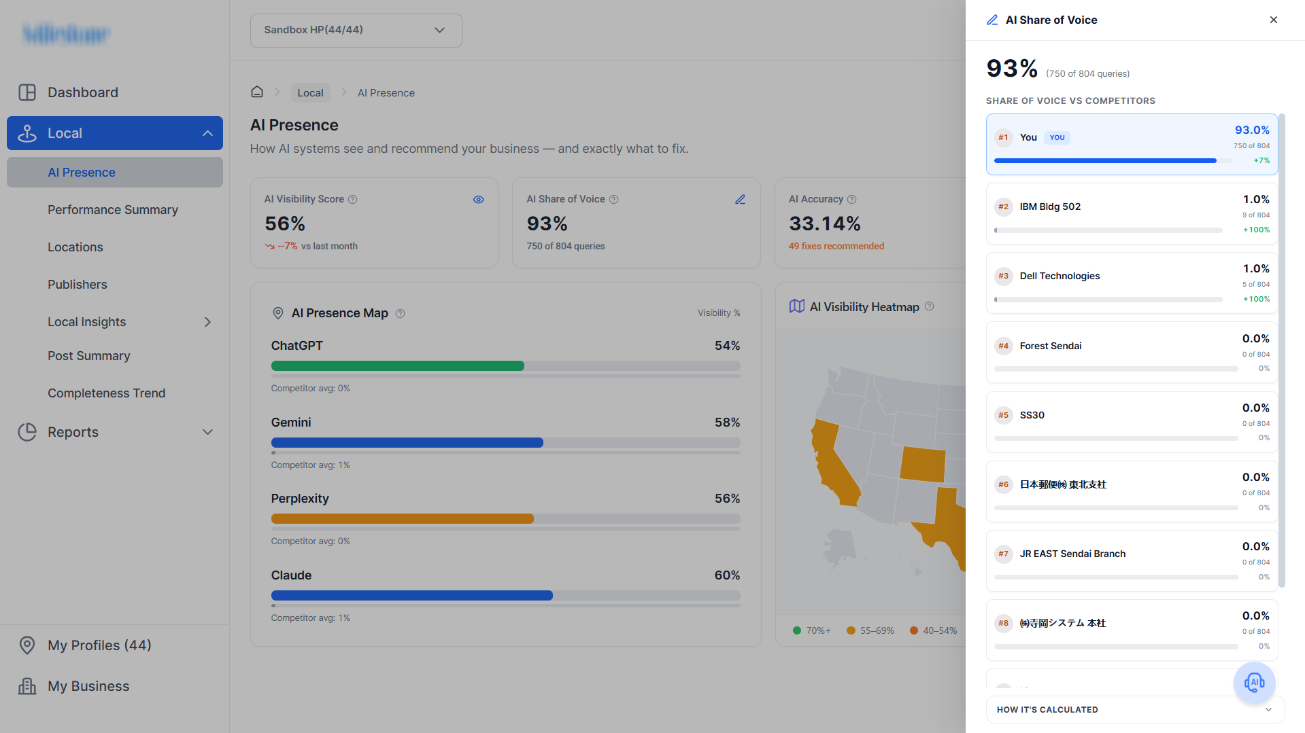
The AI Share of Voice metric shows how frequently your business appears across the monitored AI queries.
- Locate the AI Share of Voice card.
- Review the percentage shown.
- Check the number of queries underneath the score.
For example, 93% Share of Voice across 750 of 804 queries means the business appeared across a large proportion of the queries being evaluated.
Use Share of Voice together with the Visibility Score to understand both how frequently your business appears and how strong its overall AI presence is.
Step 4: Review the AI Accuracy Score
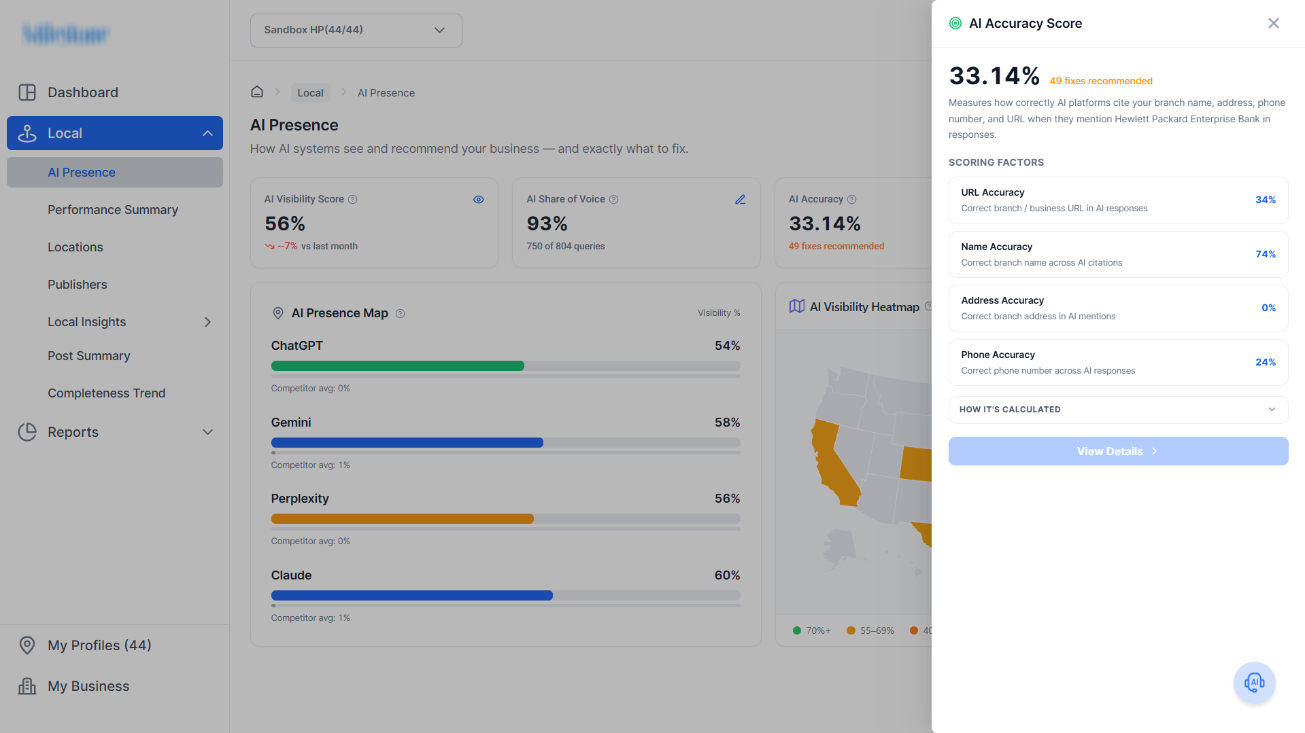
The AI Accuracy Score measures how correctly AI platforms represent important information about your business.
- Locate the AI Accuracy card.
- Review the overall accuracy percentage.
- Check the number of recommended fixes displayed below the score.
- Select the card to open the AI Accuracy Score panel.
- Review the individual scoring factors.
The scoring factors can include:
- URL Accuracy: Whether AI responses associate the correct branch or business URL with the location.
- Name Accuracy: Whether the correct branch or business name appears in AI responses and citations.
- Address Accuracy: Whether AI platforms identify the correct location address.
- Phone Accuracy: Whether the correct phone number appears in AI responses.
Reviewing these individual factors helps identify exactly which pieces of business information may be affecting overall accuracy.
Step 5: Identify Accuracy Issues That Need Attention
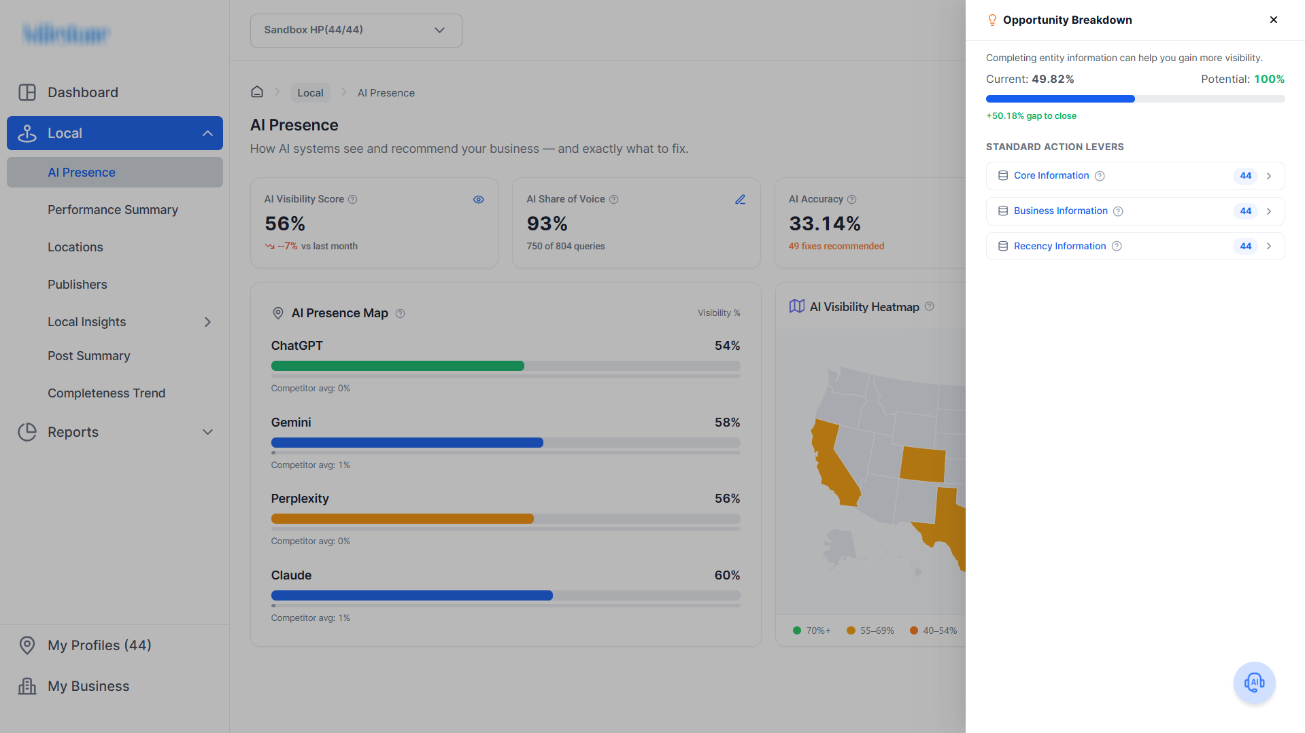
Do not rely only on the overall AI Accuracy percentage.
- Compare the scores for URL, Name, Address, and Phone Accuracy.
- Identify the categories with the lowest scores.
- Prioritize information that is incorrect, missing, or inconsistent.
- Expand How It's Calculated if additional scoring information is required.
- Select View Details to investigate the underlying issues.
For example, if Name Accuracy is strong but Address Accuracy is very low, address information should become a priority for review.
Step 6: Review the Opportunity Score
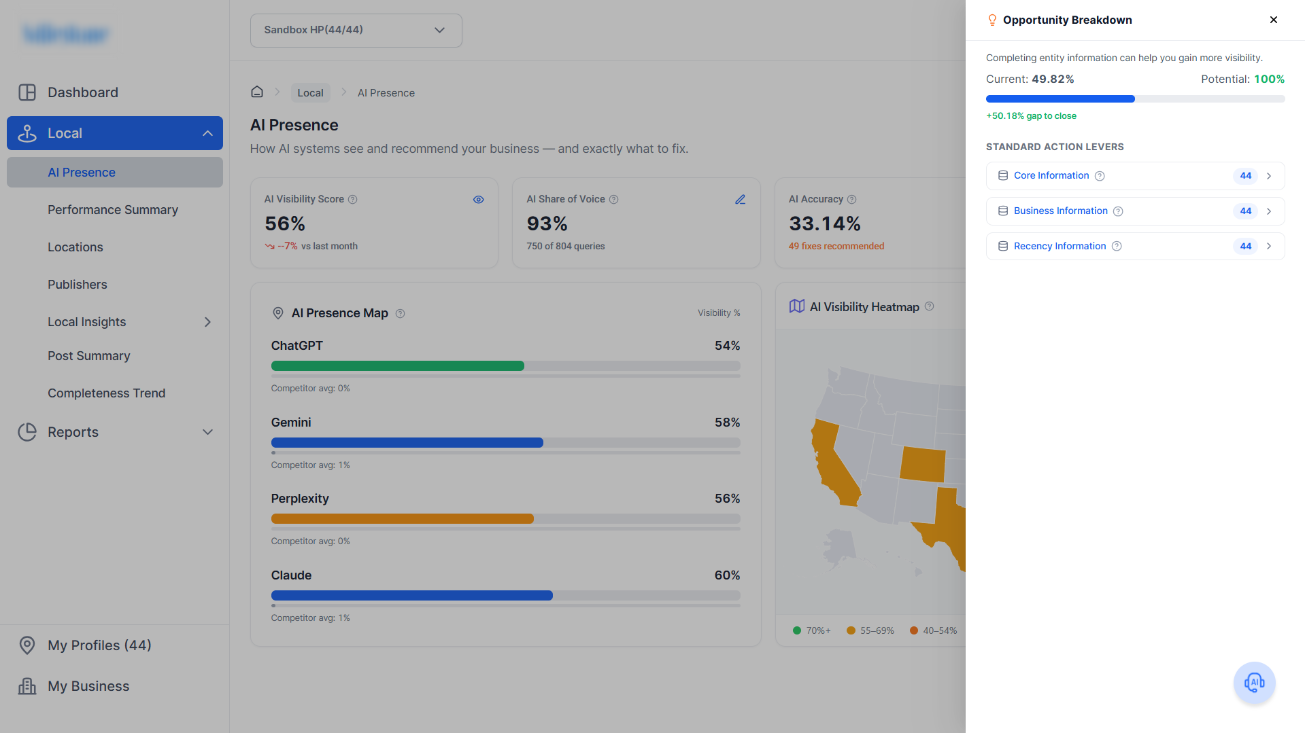
The Opportunity Score identifies how much additional visibility may be available if incomplete or missing business information is addressed.
- Locate the Opportunity Score card.
- Review the potential score displayed.
- Review the percentage gap shown below it.
- Select the Opportunity Score to open the Opportunity Breakdown.
The panel compares:
- Current performance
- Potential performance
- The remaining gap to close
For example, a current score of 49.82% with a potential of 100% represents a 50.18% gap to close.
This helps move AI Presence from measurement into action by showing how much improvement may be available.
Step 7: Review the Opportunity Action Levers
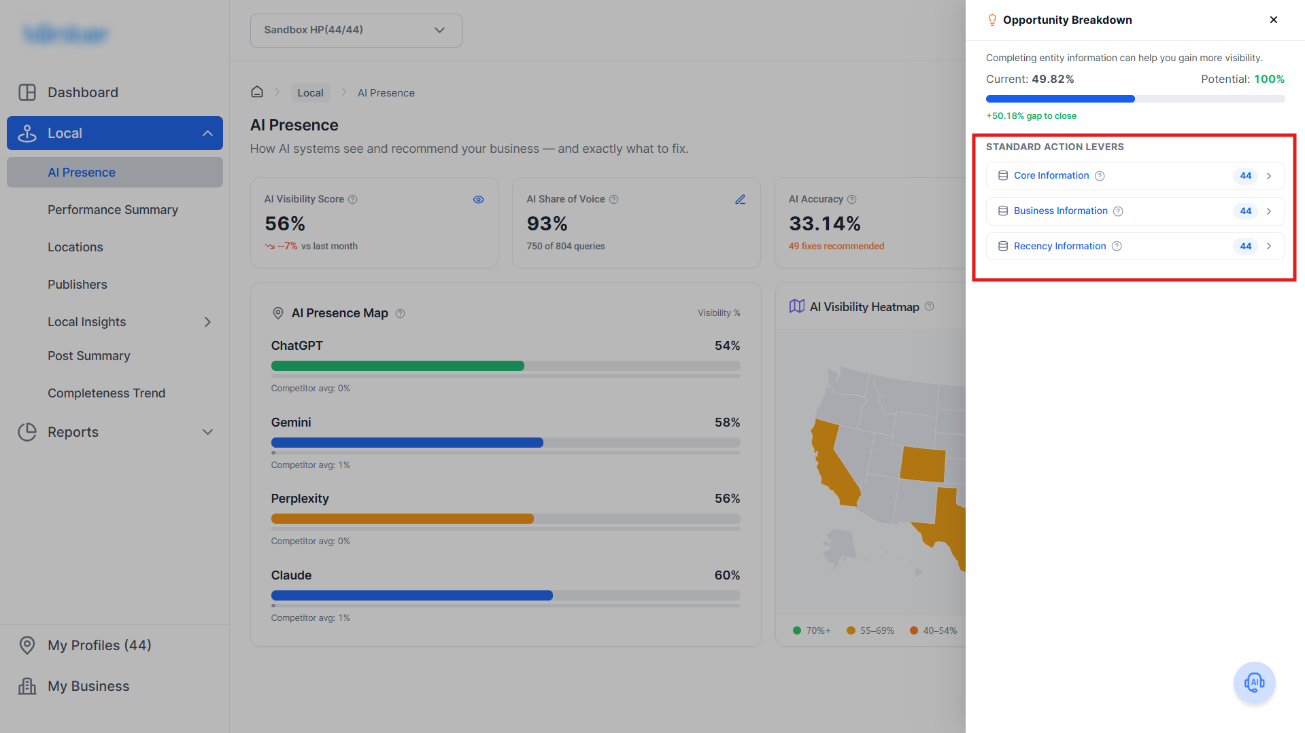
The Opportunity Breakdown groups optimization opportunities into actionable categories.
The dashboard includes:
- Core Information
- Business Information
- Recency Information
- Review the number displayed beside each category.
- Select a category to see the affected profiles.
- Prioritize categories affecting the largest number of locations or containing critical business information.
- Work through the affected profiles and address the recommended gaps.
These action levers help identify what information should be improved instead of only showing that an opportunity exists.
Step 8: Identify Missing Core Information
Select Core Information to find locations where foundational business details may be missing.
The dashboard may flag missing information such as:
- Name
- Primary Category
- Address or Service Area
- Phone
- Website
- Long Description
- Short Description
- Business Hours
- Latitude and Longitude
- CTA Details
- More Hours
To review affected locations:
- Read the notification at the top of the panel to understand which fields are missing.
- Use the Search field to find a specific profile if required.
- Review the profiles listed underneath.
- Select the relevant profile to investigate and update its information.
- Continue through the remaining affected profiles.
Completing this information gives AI platforms stronger and more consistent business data to work with.
Step 9: Review Business Information and Recency Information
After reviewing Core Information:
- Return to the Opportunity Breakdown.
- Select Business Information.
- Review the affected locations and any recommended profile improvements.
- Return to the Opportunity Breakdown.
- Select Recency Information.
- Identify profiles containing information that may require updating or refreshing.
A profile can be complete but still underperform if its information is outdated. Maintaining current information helps AI platforms work with more reliable business data.
Step 10: Compare Visibility Across AI Platforms
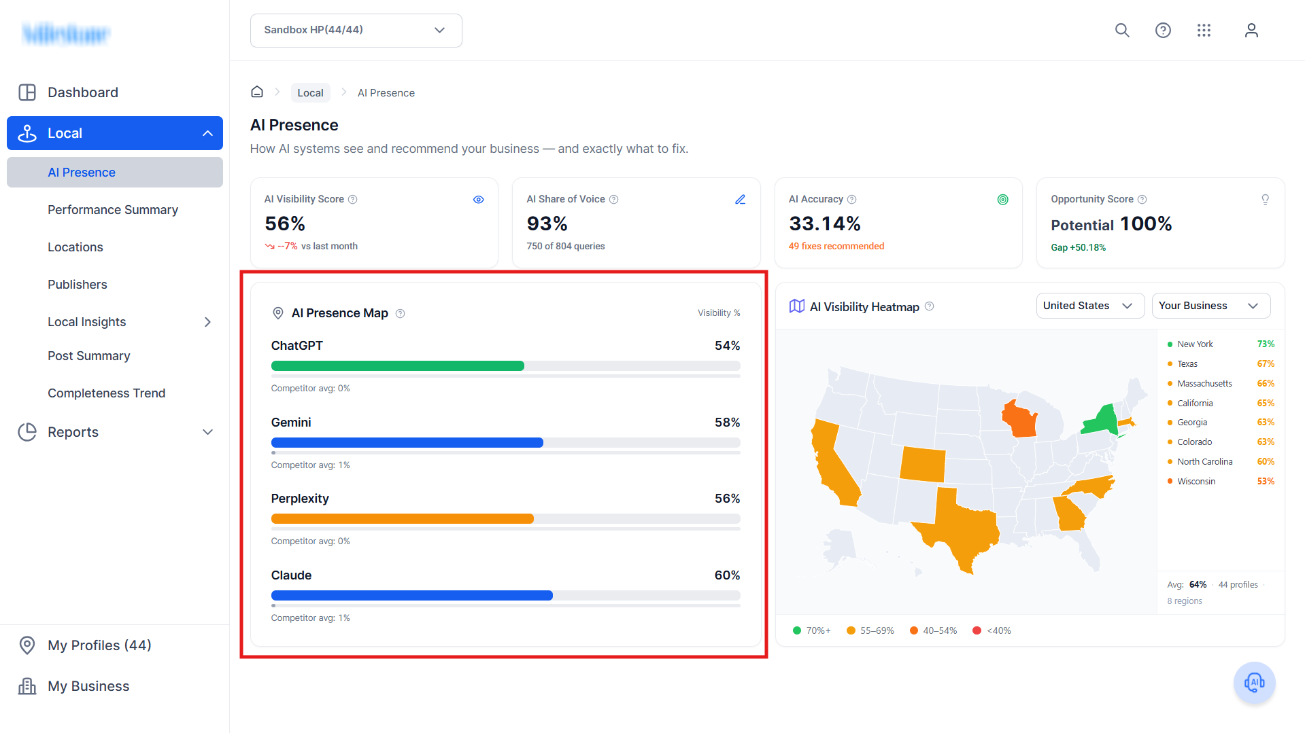
The AI Presence Map shows how your visibility differs across individual AI platforms.
The dashboard currently displays platforms such as:
- ChatGPT
- Gemini
- Perplexity
- Claude
- Locate the AI Presence Map.
- Review the visibility percentage shown for each AI platform.
- Compare performance across platforms.
- Review the competitor average displayed underneath each platform where available.
A business may perform strongly on one AI platform but have weaker visibility on another. Reviewing platform-level performance helps identify these differences.
Step 11: Review Geographic Visibility With the AI Visibility Heatmap
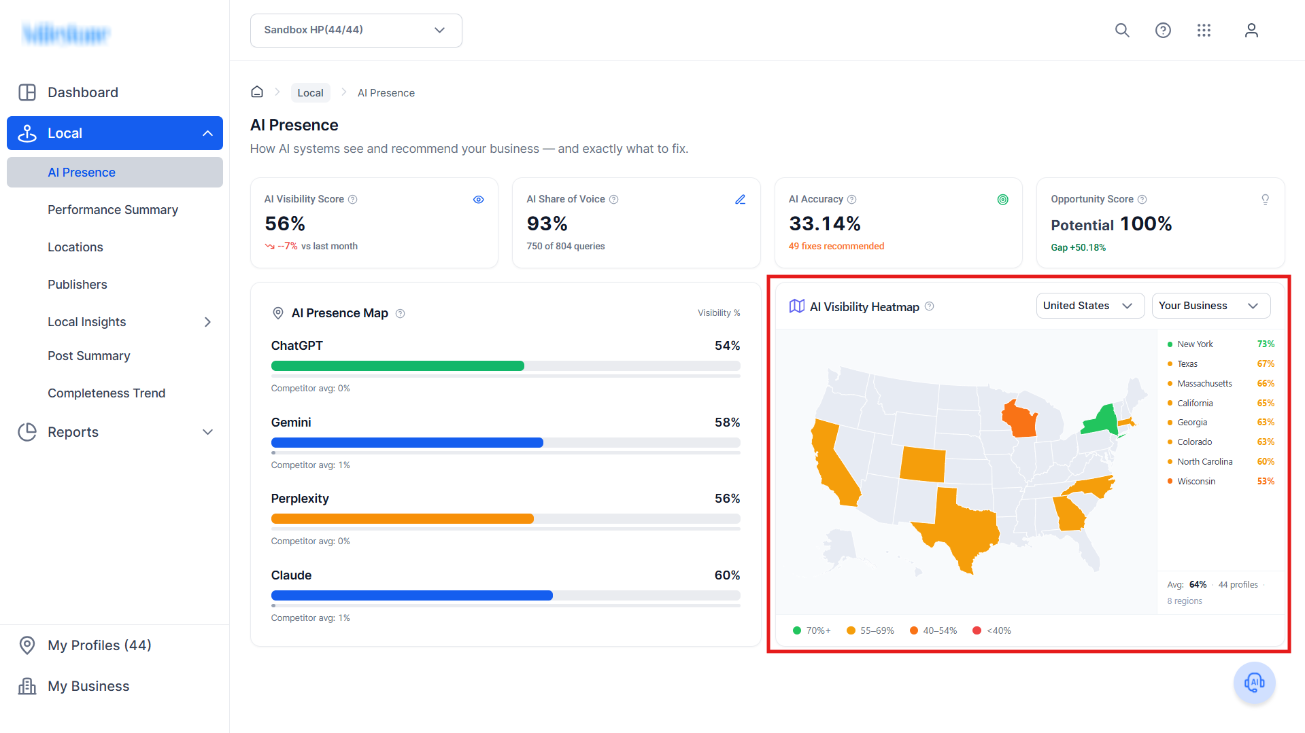
The AI Visibility Heatmap shows how AI visibility varies across geographic markets.
- Locate the heatmap on the right side of the dashboard.
- Review the highlighted states or regions.
- Use the color legend beneath the map to interpret performance.
The dashboard groups visibility into performance ranges such as:
- 70%+
- 55% to 69%
- 40% to 54%
- Below 40%
The list beside the map provides additional regional performance information and allows you to quickly identify stronger and weaker markets.
Step 12: Hover Over a Region for More Detail
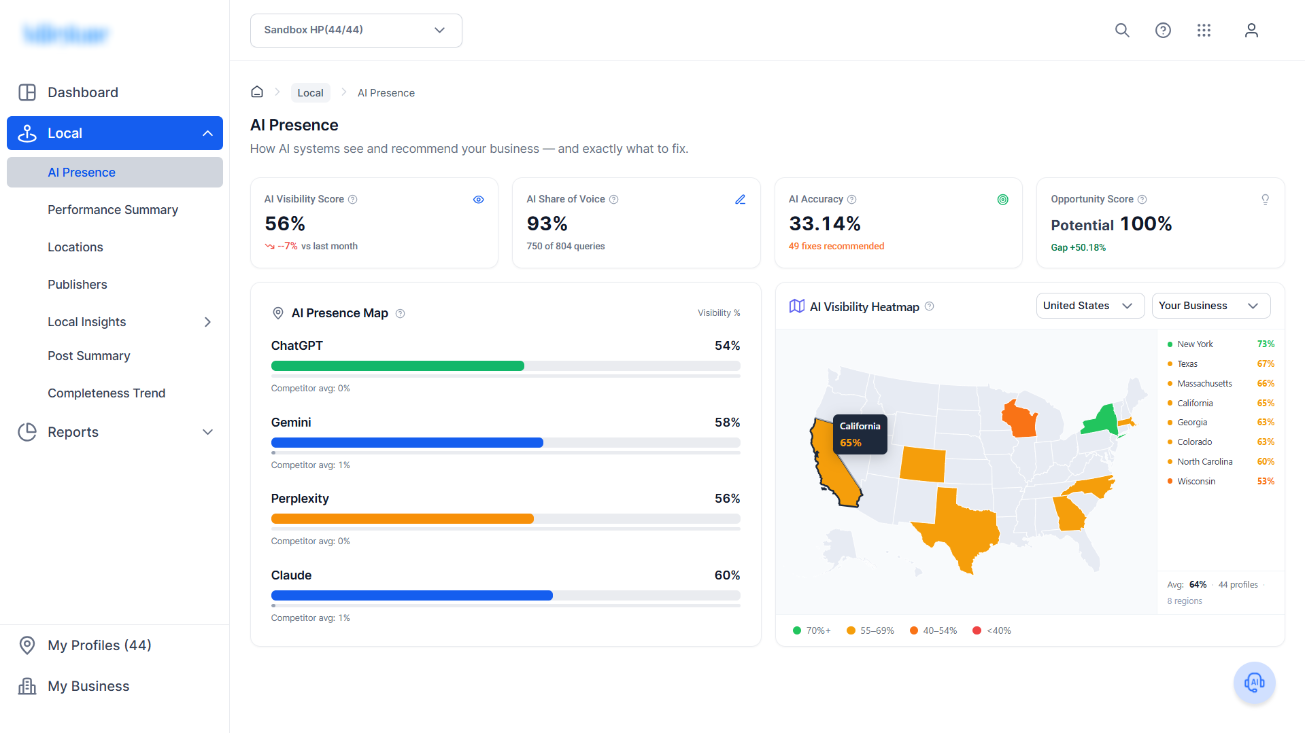
You can inspect individual regions directly from the heatmap.
- Move the cursor over a highlighted region.
- A tooltip displays the region name.
- Review the visibility percentage displayed in the tooltip.
- Compare that region against other markets and the overall average.
For example, hovering over California displays the state's visibility percentage directly on the map.
This makes it easier to investigate regional differences without leaving the dashboard.
Step 13: Change the Country
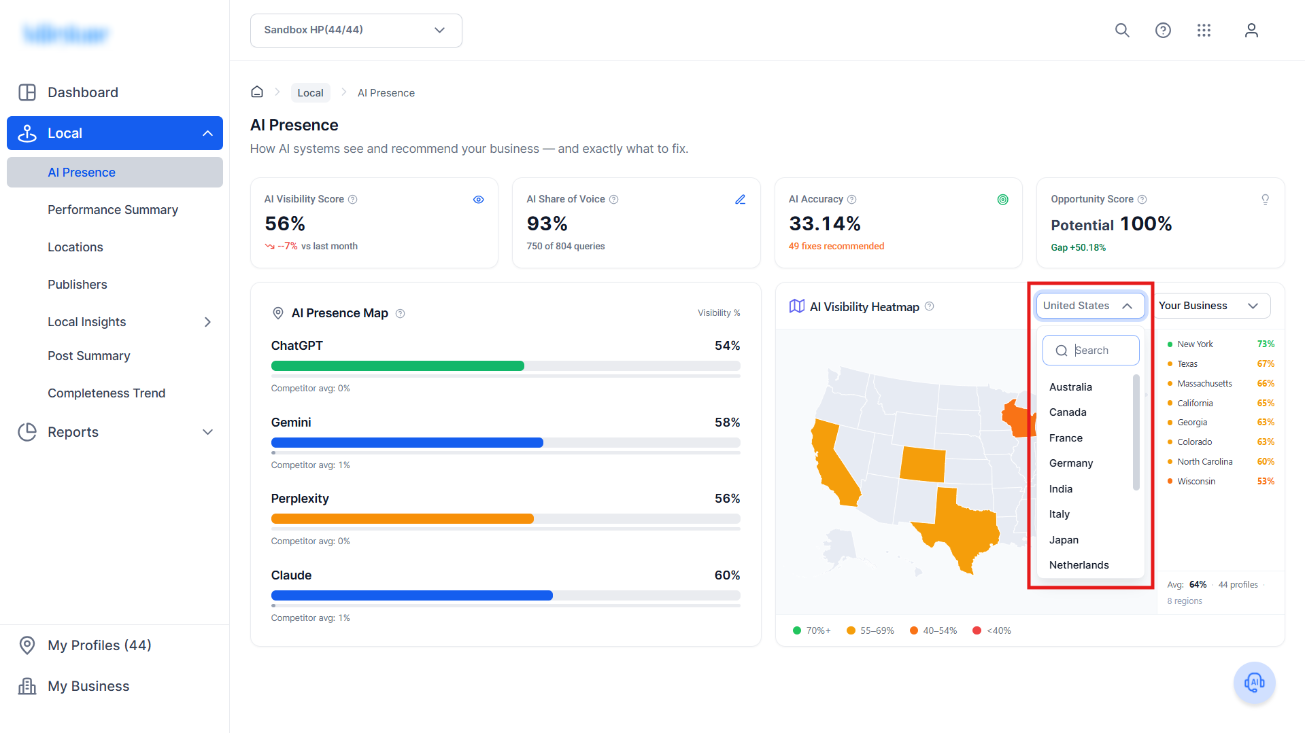
For businesses operating across multiple countries, use the country selector above the heatmap.
- Select the country dropdown.
- Scroll through the available countries or use the search field.
- Select the country you want to analyze.
- Review the geographic visibility information for the selected market.
Step 14: Compare Your Business With Competitors
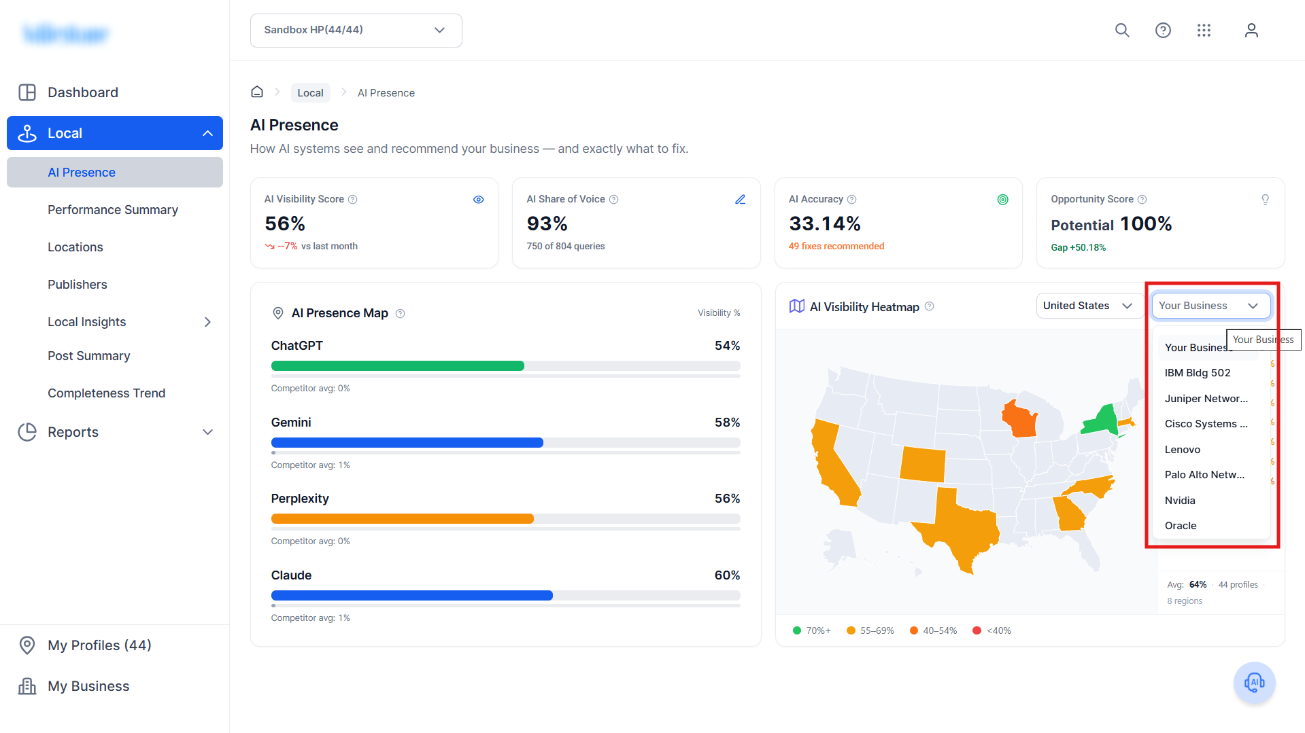
The business selector above the heatmap can be used to compare your geographic visibility with competitors.
- Select the Your Business dropdown.
- Review the available businesses.
- Select a competitor.
- Review its geographic visibility on the heatmap.
- Compare its performance with your own business.
- Select Your Business again to return to your own performance.
Competitive comparison provides important context. A visibility score becomes more useful when you can see how your business performs against other organizations competing for similar AI-generated recommendations.
Step 15: Identify Priority Markets
Use multiple areas of the dashboard together to determine where optimization efforts should begin.
- Use the AI Visibility Heatmap to identify weaker regions.
- Check the AI Accuracy Score to see whether incorrect information could be affecting visibility.
- Open the Opportunity Breakdown.
- Determine whether locations in weaker markets have missing Core, Business, or Recency Information.
- Address the recommended improvements.
- Continue monitoring the dashboard to see whether visibility changes after updates are made.
This connects geographic performance with specific optimization actions.
Step 16: Use AI Presence as an Ongoing Optimization Workflow
For regular monitoring, use the dashboard in the following sequence:
- Review AI Visibility Score to understand your overall discoverability.
- Check AI Share of Voice to understand how consistently your business appears across monitored queries.
- Review AI Accuracy to identify information AI platforms may be representing incorrectly.
- Open Opportunity Score to find areas where profile improvements could strengthen visibility.
- Complete missing business information across affected profiles.
- Compare AI platforms to identify differences between ChatGPT, Gemini, Perplexity, Claude, and other supported platforms.
- Review the geographic heatmap to identify stronger and weaker markets.
- Compare competitors to understand your relative presence within each market.
- Return to the dashboard regularly to measure progress and identify new optimization opportunities.
The AI Presence Dashboard is designed to connect AI performance with actionable business information. Regularly reviewing visibility, accuracy, opportunities, geographic performance, and competitor presence can help teams improve how clearly and consistently their locations are understood and surfaced by AI platforms.
Was this article helpful?
That’s Great!
Thank you for your feedback
Sorry! We couldn't be helpful
Thank you for your feedback
Feedback sent
We appreciate your effort and will try to fix the article